Fig. 9
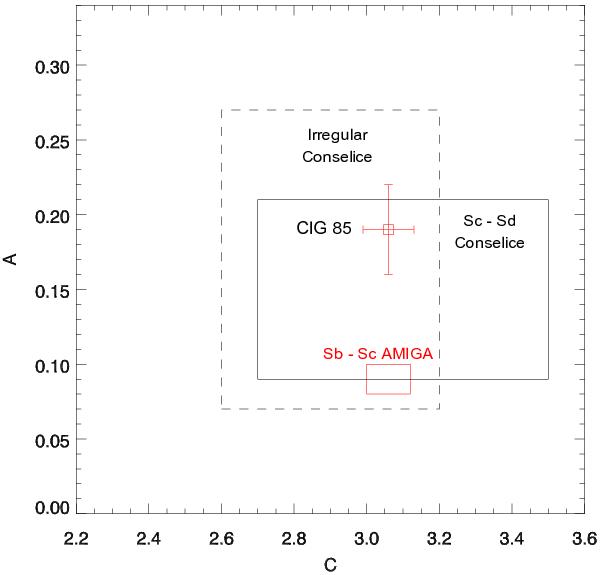
CIG 85 r-band C (concentration) and A (asymmetry) parameters with error bars- red point. The range of A and C CAS parameters for Sb-Sc spirals (sample size ~ 100) from the AMIGA sample (Durbala et al. 2008) are indicated with the red rectangle. The range of the same A and C parameters from Conselice (2003) is displayed for irregular and Sc-Sd morphologies respectively as a dashed black rectangle and a solid black rectangle.
Current usage metrics show cumulative count of Article Views (full-text article views including HTML views, PDF and ePub downloads, according to the available data) and Abstracts Views on Vision4Press platform.
Data correspond to usage on the plateform after 2015. The current usage metrics is available 48-96 hours after online publication and is updated daily on week days.
Initial download of the metrics may take a while.