Fig. 7
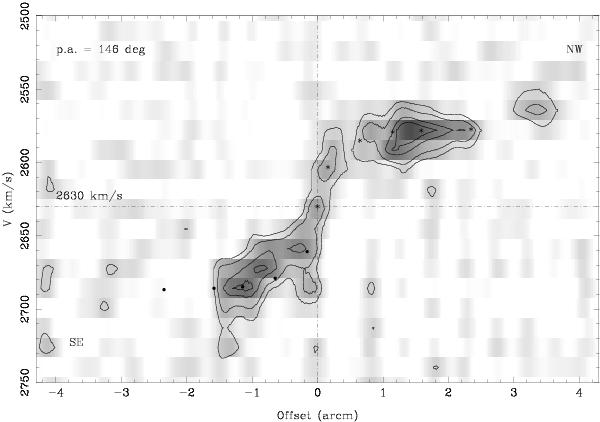
Position–velocity cut along a position angle of ~146°. The zero point in the figure corresponds to 02h03m21.276s and 22 02 47.59. The vertical line corresponds to this zero position, and the horizontal line to the velocity that maximises symmetry between the receding and approaching sides of the curve (in this particular cut, 2630 km s-1). The stars trace the approaching side and the dots the receding side, in order to illustrate the differences between each side.
Current usage metrics show cumulative count of Article Views (full-text article views including HTML views, PDF and ePub downloads, according to the available data) and Abstracts Views on Vision4Press platform.
Data correspond to usage on the plateform after 2015. The current usage metrics is available 48-96 hours after online publication and is updated daily on week days.
Initial download of the metrics may take a while.