Fig. 3
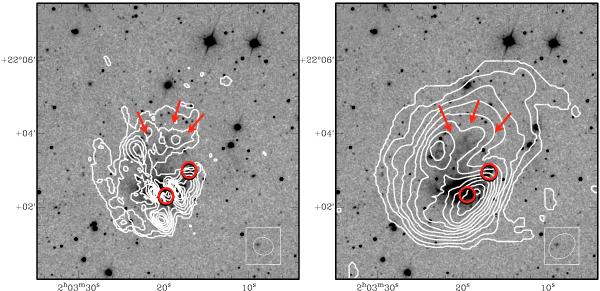
Integrated H i contours on an SDSS r-band image, where the three faint optical arm like features are marked with red arrows and 020036+21480-b AND 020036+21480-c by circles. (Left) high resolution integrated emission, (beam size = 24.3′′ × 21.0′′) where the H i column density levels are 1020 atoms cm-2 × (1.0, 1.9, 3.2, 5.3, 7.5, 9.6, 11.8, 13.9, 16.1). (Right) low resolution integrated emission, (beam size = 47.1′′ × 37.1′′) where the the H i column density levels are 1020 atoms cm-2 × (0.56, 1.2, 2.2, 3.4, 4.7, 6.0, 6.9, 8.2, 9.4, 11.0). The beam is shown at the bottom right of each panel.
Current usage metrics show cumulative count of Article Views (full-text article views including HTML views, PDF and ePub downloads, according to the available data) and Abstracts Views on Vision4Press platform.
Data correspond to usage on the plateform after 2015. The current usage metrics is available 48-96 hours after online publication and is updated daily on week days.
Initial download of the metrics may take a while.