Free Access
Fig. 9
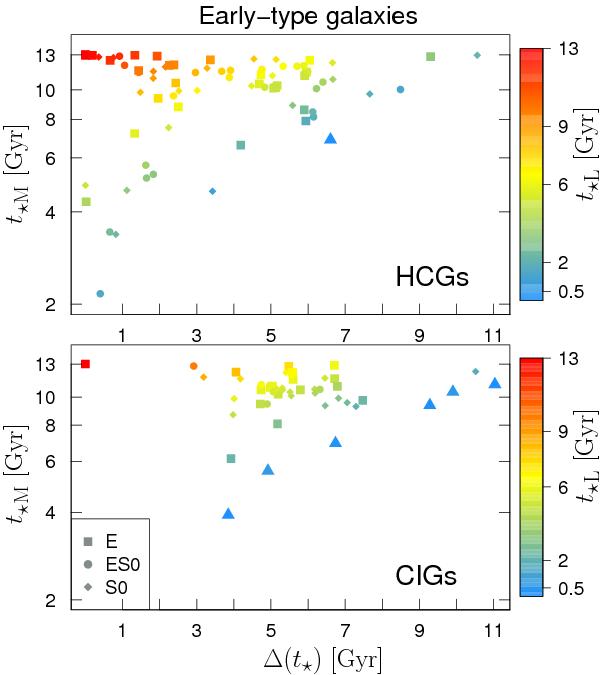
Star formation activity time scale traced in terms of mass-weighted age t ⋆ M as a function of Δ(t⋆) for EtG in HCG sample (top panel) and the CIG sample (bottom panel). The color-code bar corresponds to light-weighted age t ⋆ L. Triangles represent the peculiar galaxies.
Current usage metrics show cumulative count of Article Views (full-text article views including HTML views, PDF and ePub downloads, according to the available data) and Abstracts Views on Vision4Press platform.
Data correspond to usage on the plateform after 2015. The current usage metrics is available 48-96 hours after online publication and is updated daily on week days.
Initial download of the metrics may take a while.