Fig. 5
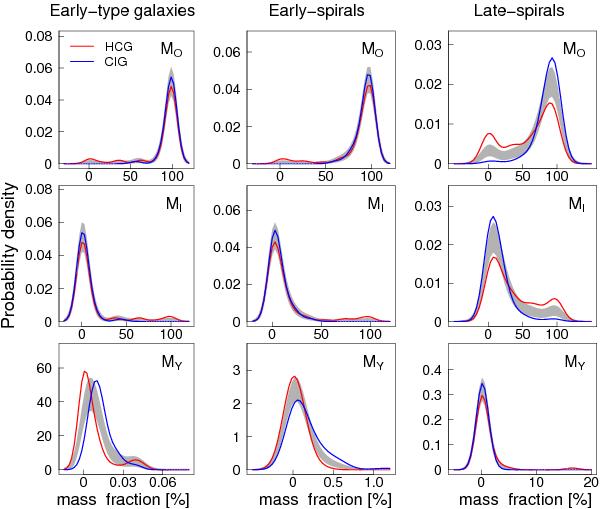
Percentage contribution of the mass-weighted population vectors (top to bottom) MO, MI, and MY, as measured in the different morphological classes, (left to right) EtG, EtS, and LtS galaxies. The red and blue curves are the density distributions for the HCG and CIG, respectively. The gray areas are the confidence interval models, assuming the two samples come from the same distribution. In each graph the curves are the continuous representation of the distribution. These curves were produced using the SM function in the R statistical package.
Current usage metrics show cumulative count of Article Views (full-text article views including HTML views, PDF and ePub downloads, according to the available data) and Abstracts Views on Vision4Press platform.
Data correspond to usage on the plateform after 2015. The current usage metrics is available 48-96 hours after online publication and is updated daily on week days.
Initial download of the metrics may take a while.