Fig. 4
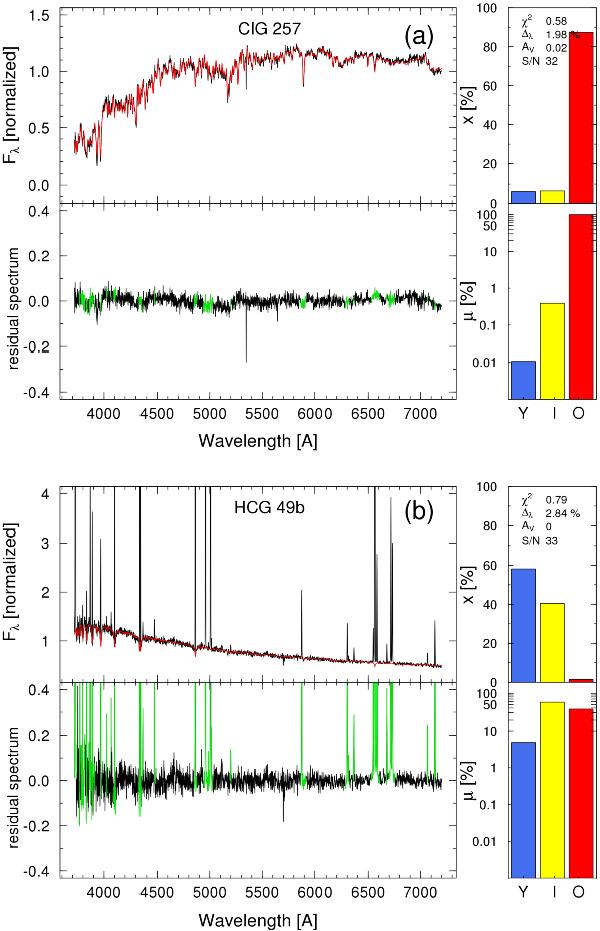
Spectral synthesis results for two galaxies in our samples. a) An early-type galaxy, CIG 257; and b) a late-type galaxy, HCG 49b. The top-left plot in each panel shows the synthetic spectrum (red curve), plotted over the observed spectrum (black curve) normalized by the flux at λ = 4550Å; the bottom-left plot shows the residual spectrum (the difference between the observed and the synthetic continuum spectra), with the green regions representing the mask used; the top-right plot shows the percentage contribution of the light-weighted population vector (x [%] ), and the bottom-right plot the percentage contribution of the mass-weighted population vector (μ [%] in logarithmic scale), as calculated in each of the three different SSP age groups: young (blue bar), intermediate (yellow bar), and old stellar population bins (red bar).
Current usage metrics show cumulative count of Article Views (full-text article views including HTML views, PDF and ePub downloads, according to the available data) and Abstracts Views on Vision4Press platform.
Data correspond to usage on the plateform after 2015. The current usage metrics is available 48-96 hours after online publication and is updated daily on week days.
Initial download of the metrics may take a while.