Fig. 6
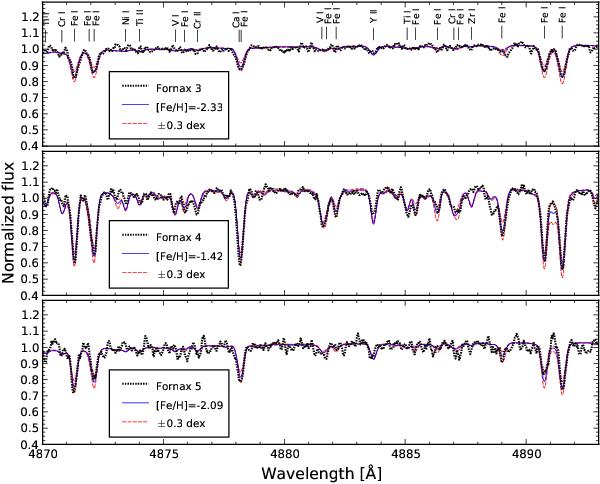
Fits to a small part of the UVES spectra (dotted, thick black curves). The thin, solid curves (blue in the on-line edition) show the synthetic spectra for the overall best-fitting Fe abundances, while the thin dashed curves (red in the on-line edition) show the effect of of varying the Fe abundance by ± 0.3 dex. The spectra have been smoothed with a 5 pixels wide boxcar filter.
Current usage metrics show cumulative count of Article Views (full-text article views including HTML views, PDF and ePub downloads, according to the available data) and Abstracts Views on Vision4Press platform.
Data correspond to usage on the plateform after 2015. The current usage metrics is available 48-96 hours after online publication and is updated daily on week days.
Initial download of the metrics may take a while.