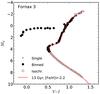
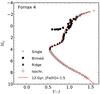
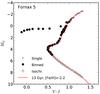
Fig. 4
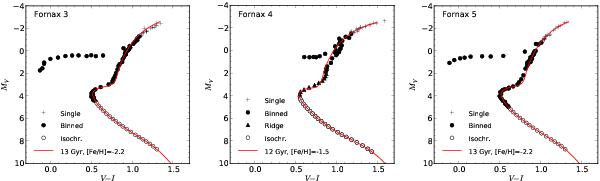
Binned colour − magnitude diagrams used in the generation of synthetic integrated-light spectra. The plus markers denote individual stars, filled circles are bins of multiple stars, and open squares are model extrapolations from the Dotter et al. (2007) isochrones. For Fornax 4, the Buonanno et al. (1999) ridge line was used near the main sequence turn-off and for the subgiants, shown with filled triangles. Theoretical isochrones used to model the luminosity functions (Dotter et al. 2007) are shown as red curves.
Current usage metrics show cumulative count of Article Views (full-text article views including HTML views, PDF and ePub downloads, according to the available data) and Abstracts Views on Vision4Press platform.
Data correspond to usage on the plateform after 2015. The current usage metrics is available 48-96 hours after online publication and is updated daily on week days.
Initial download of the metrics may take a while.