Fig. 5
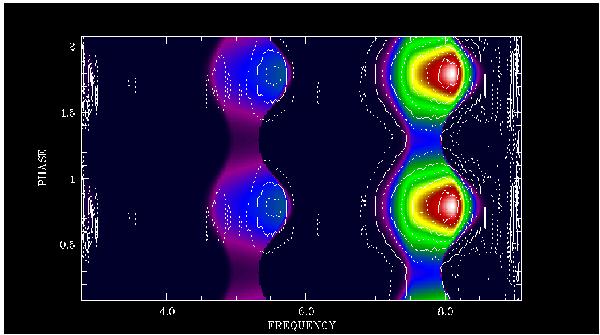
2D representation of the phase-dependent observed and calculated cyclotron lines of RX J1007 in 1997. The best-fit calculated spectral flux (color) is compared with the observed fluxes (contour lines). The abscissa is frequency in units of 1014 Hz, the ordinate is phase and data and model are displayed twice. The image shows the second and third harmonic with an indication of the first harmonic at the lowest frequencies.
Current usage metrics show cumulative count of Article Views (full-text article views including HTML views, PDF and ePub downloads, according to the available data) and Abstracts Views on Vision4Press platform.
Data correspond to usage on the plateform after 2015. The current usage metrics is available 48-96 hours after online publication and is updated daily on week days.
Initial download of the metrics may take a while.