Fig. 15
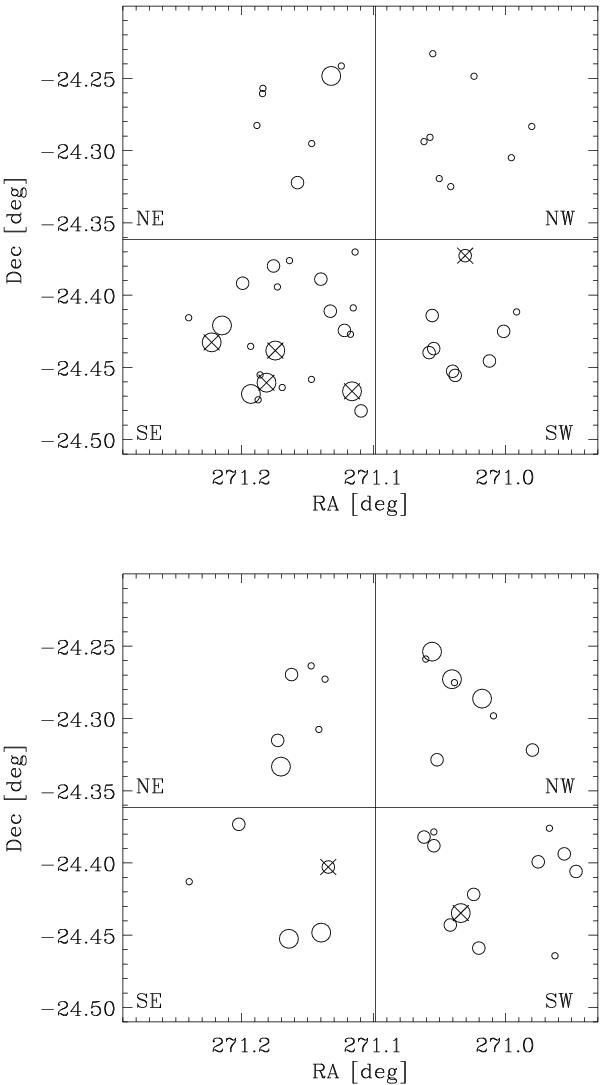
Spatial distribution of the populations youngest (top panel) and oldest (bottom panel) than 2.0 Myr (empty circles). Different circle sizes correspond to objects with E(V − I) < 0.5 (smallest circles), 0.5 ≤ E(V − I) < 1.0 (medium circles) and E(V − I) ≥ 1 (largest circles). X symbols indicate objects with mass larger than 2.5 M⊙. The four regions corresponding to the four VIMOS CCD quadrants are also indicated.
Current usage metrics show cumulative count of Article Views (full-text article views including HTML views, PDF and ePub downloads, according to the available data) and Abstracts Views on Vision4Press platform.
Data correspond to usage on the plateform after 2015. The current usage metrics is available 48-96 hours after online publication and is updated daily on week days.
Initial download of the metrics may take a while.