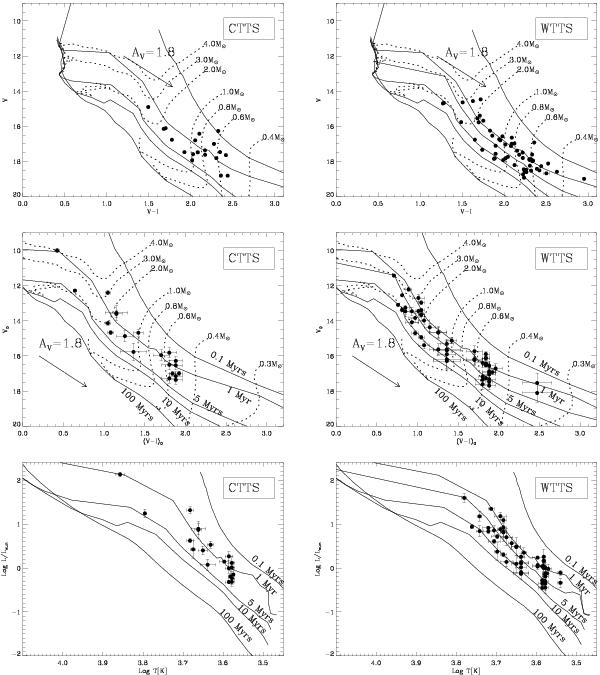
Fig. 13

V vs. V − I diagram obtained by using observed (top panels) and dereddened (middle panels) magnitudes and colors for the CTT and WTT cluster members with E(V − I) > 0. Solid and dotted lines are the Siess et al. (2000) isochrones and track, respectively, assuming the cluster distance of 1250 pc (Prisinzano et al. 2005). In the top panel, the isochrones are reddened by assuming the literature mean reddening E(B − V) = 0.35 (Sung et al. 2000) and the Munari & Carraro (1996) reddening laws for RV = 5.0. In the middle panel, isochrones are only scaled for the cluster distance. The arrow indicates the reddening vector corresponding to E(B − V) = 0.35 for RV = 5.0. The HR diagrams of the two samples are shown in the bottom panels.
Current usage metrics show cumulative count of Article Views (full-text article views including HTML views, PDF and ePub downloads, according to the available data) and Abstracts Views on Vision4Press platform.
Data correspond to usage on the plateform after 2015. The current usage metrics is available 48-96 hours after online publication and is updated daily on week days.
Initial download of the metrics may take a while.


