Free Access
Fig. 12
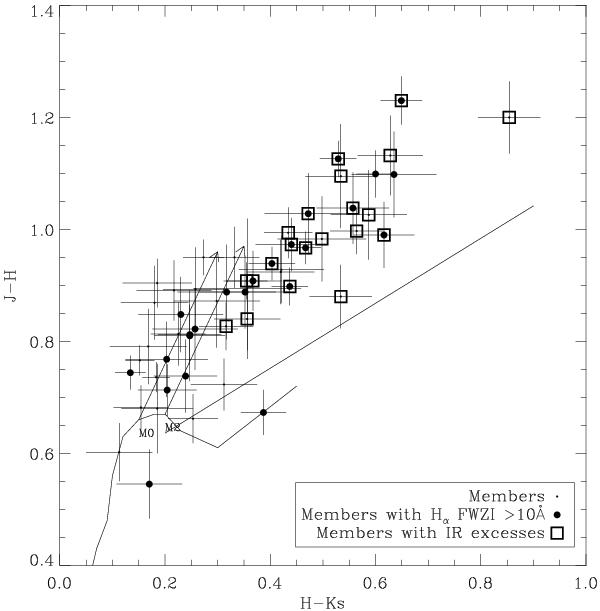
J − H vs. H − K diagram of our targets. The solid curve is the Kenyon & Hartmann (1995) locus for the colors of main sequence stars, the two arrows indicate the reddening vectors corresponding to AV = 3 starting from colors of M0 and M2 dwarfs, and the solid line is the CTTS locus by Meyer et al. (1997).
Current usage metrics show cumulative count of Article Views (full-text article views including HTML views, PDF and ePub downloads, according to the available data) and Abstracts Views on Vision4Press platform.
Data correspond to usage on the plateform after 2015. The current usage metrics is available 48-96 hours after online publication and is updated daily on week days.
Initial download of the metrics may take a while.