Fig. 7
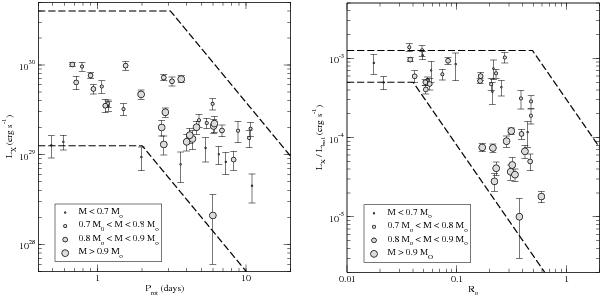
Left: X-ray luminosities of the M 34 sample stars vs. rotation periods. Right: X-ray to bolometric luminosity ratios vs. Rossby numbers. The mass of each star is indicated by the size of the associated circle. The dashed lines represent the lower and upper limits of the correlation results LX vs. Prot and LX/Lbol vs. Ro established by Pizzolato et al. (2003) for masses in the range 0.63–0.78 M⊙ (lower curve) and 1.03–1.10 M⊙ (upper curve), respectively.
Current usage metrics show cumulative count of Article Views (full-text article views including HTML views, PDF and ePub downloads, according to the available data) and Abstracts Views on Vision4Press platform.
Data correspond to usage on the plateform after 2015. The current usage metrics is available 48-96 hours after online publication and is updated daily on week days.
Initial download of the metrics may take a while.