Free Access
Fig. 2
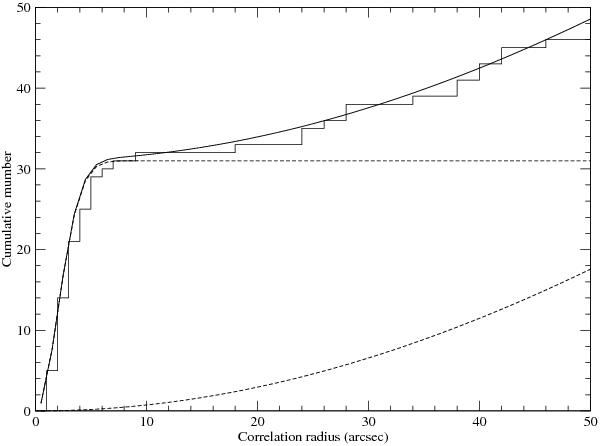
Cumulative numbers of correlations between the X-ray detections and the M 34 time-series photometric survey of M 11. The dotted curves correspond to the best fitting expressions for the real and spurious correlations. The continuous curve yields the sum of these terms.
Current usage metrics show cumulative count of Article Views (full-text article views including HTML views, PDF and ePub downloads, according to the available data) and Abstracts Views on Vision4Press platform.
Data correspond to usage on the plateform after 2015. The current usage metrics is available 48-96 hours after online publication and is updated daily on week days.
Initial download of the metrics may take a while.