Fig. 11
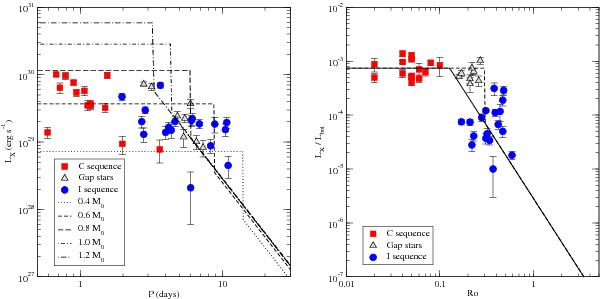
Right: X-ray to bolometric luminosity ratios of M 34 sample stars vs. Rossby numbers. The solid line represents the rotation-activity relationship derived by Wright et al. (2011), and the dashed line represents the X-ray evolution model set-up in the present study based on M 34 data. Left: X-ray luminosities vs. rotation periods of M 34 stars compared with this X-ray evolution model for stellar masses in the range 0.4 ≤ M/M⊙ ≤ 1.2. In both graphs, M 34 stars represented as red squares belong to the C sequence. M 34 stars represented as blue circles are members of the I sequence. Triangles represent M 34 gap stars assumed to be evolving from the C sequence towards the I sequence.
Current usage metrics show cumulative count of Article Views (full-text article views including HTML views, PDF and ePub downloads, according to the available data) and Abstracts Views on Vision4Press platform.
Data correspond to usage on the plateform after 2015. The current usage metrics is available 48-96 hours after online publication and is updated daily on week days.
Initial download of the metrics may take a while.