Fig. 10
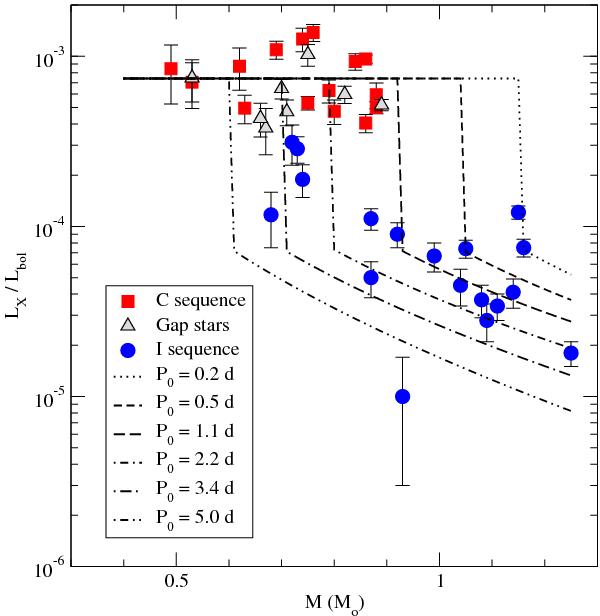
X-ray to bolometric luminosity ratios of the M 34 sample stars vs. masses compared with an X-ray luminosity model of 220 Myr stars with initial rotation periods on the ZAMS ranging from 0.2 to 5.0 days. Stars represented as blue circles are members of the I-sequence. Stars represented as blue square belong to the C-sequence. Triangles represent gap stars assumed to be evolving from the C-sequence towards the I-sequence.
Current usage metrics show cumulative count of Article Views (full-text article views including HTML views, PDF and ePub downloads, according to the available data) and Abstracts Views on Vision4Press platform.
Data correspond to usage on the plateform after 2015. The current usage metrics is available 48-96 hours after online publication and is updated daily on week days.
Initial download of the metrics may take a while.