Free Access
Fig. 7
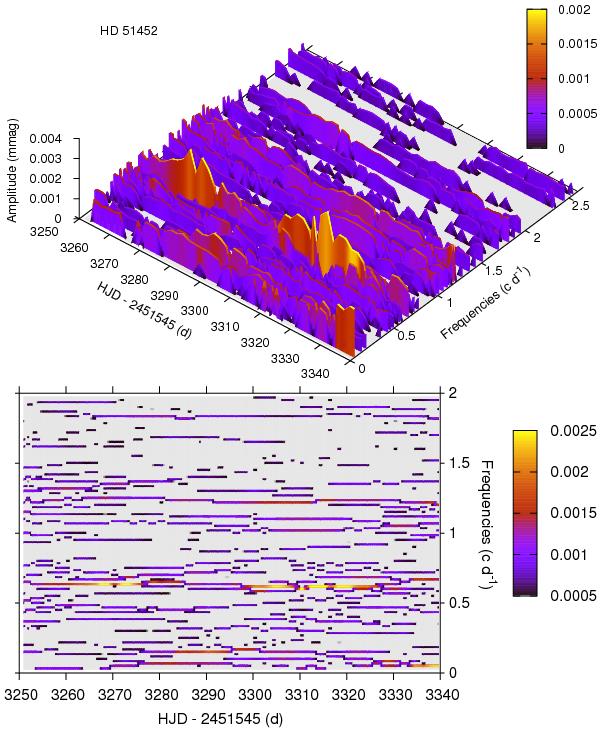
3D plot (top panel) and periodogram (bottom panel) of the results of the time-frequency analysis of the CoRoT light curve of HD 51452. In the bottom panel, the frequencies with the lowest amplitudes were truncated to make the plot clearer.
This figure is made of several images, please see below:
Current usage metrics show cumulative count of Article Views (full-text article views including HTML views, PDF and ePub downloads, according to the available data) and Abstracts Views on Vision4Press platform.
Data correspond to usage on the plateform after 2015. The current usage metrics is available 48-96 hours after online publication and is updated daily on week days.
Initial download of the metrics may take a while.