Fig. 6
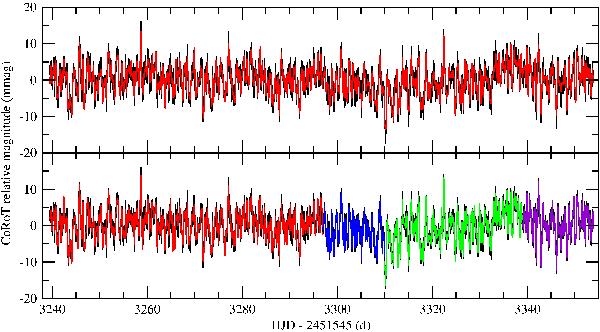
Model of the CoRoT light curve (in colors) computed with the frequencies, amplitudes, and phases determined with Clean-NG and Amphi, superimposed on the observed CoRoT light curve (in black). Top: the full light curve fitted with 189 frequencies, bottom: the light curve in 4 pieces fitted with 125, 61, 88, and 69 frequencies.
Current usage metrics show cumulative count of Article Views (full-text article views including HTML views, PDF and ePub downloads, according to the available data) and Abstracts Views on Vision4Press platform.
Data correspond to usage on the plateform after 2015. The current usage metrics is available 48-96 hours after online publication and is updated daily on week days.
Initial download of the metrics may take a while.