Fig. 5
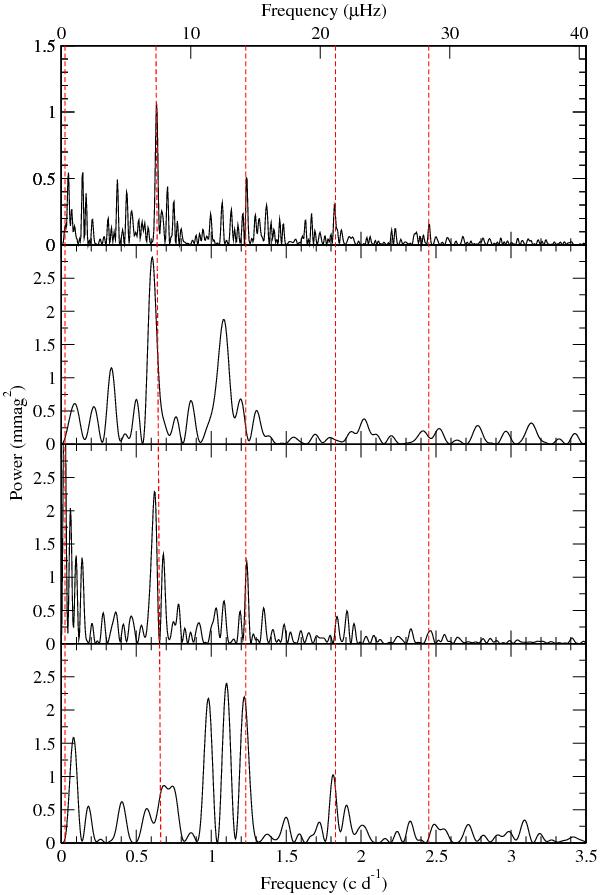
Fourier transform of the frequencies calculated with FreqFind extracted from 4 pieces of the CoRoT data: until HJD = 3297 (top), between HJD = 3297 and 3310 (second panel), between HJD = 3310 and 3339 (third panel), and after HJD = 3339 (bottom). We adjusted the oversampling value used in FreqFind to compensate for the different length of the 4 pieces. The top panel is shown with a y-range divided by 2 compared to the other 3 panels. The red dashed lines indicate the quintuplet centered on f6 (see text).
Current usage metrics show cumulative count of Article Views (full-text article views including HTML views, PDF and ePub downloads, according to the available data) and Abstracts Views on Vision4Press platform.
Data correspond to usage on the plateform after 2015. The current usage metrics is available 48-96 hours after online publication and is updated daily on week days.
Initial download of the metrics may take a while.