Free Access
Fig. 1
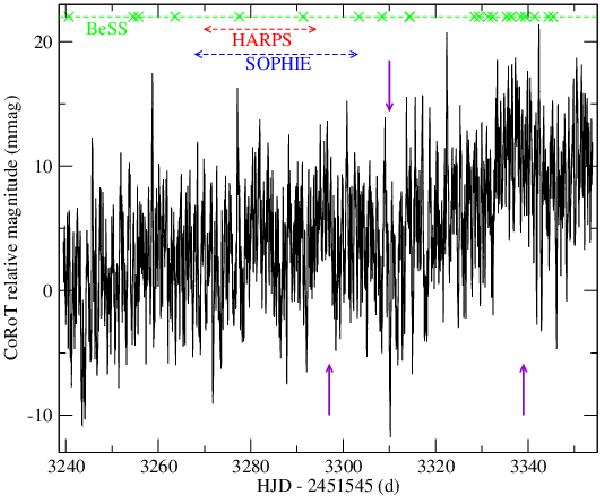
CoRoT light curve of the hot Be star HD 51452. The periods when HARPS, SOPHIE, and BeSS data were acquired are also indicated with dashed lines. For BeSS, the exact times of acquisition of spectra are marked with crosses. The 3 purple arrows indicate the time of minor outburts.
Current usage metrics show cumulative count of Article Views (full-text article views including HTML views, PDF and ePub downloads, according to the available data) and Abstracts Views on Vision4Press platform.
Data correspond to usage on the plateform after 2015. The current usage metrics is available 48-96 hours after online publication and is updated daily on week days.
Initial download of the metrics may take a while.