Fig. 6
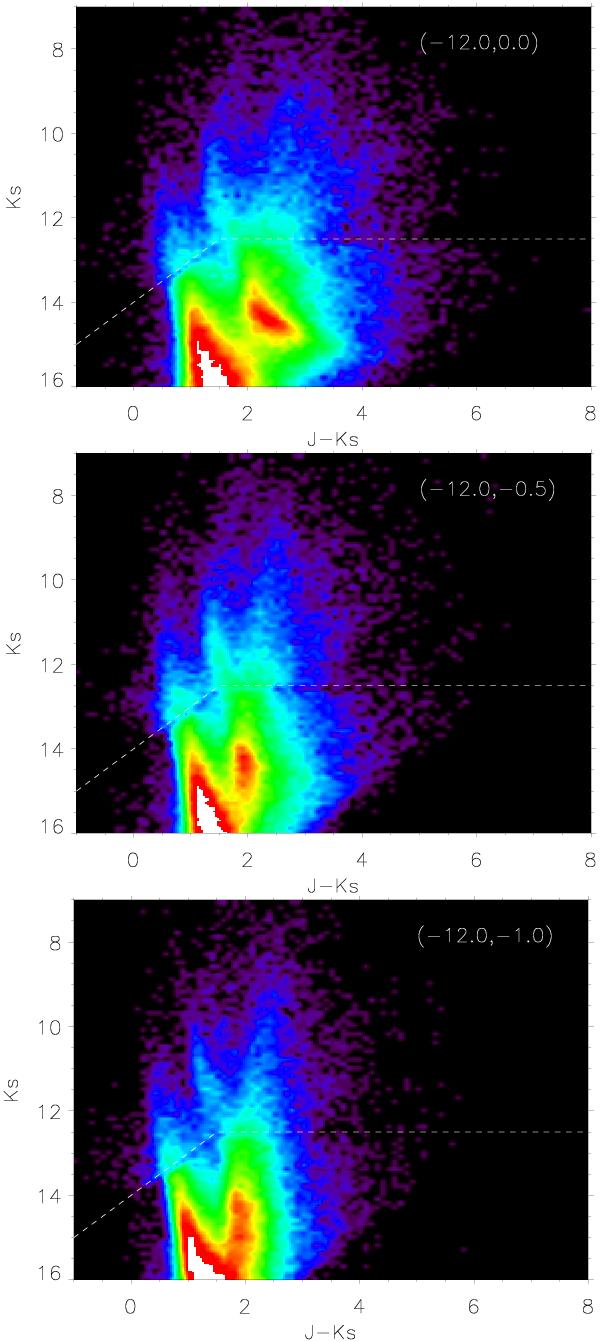
CMDs of the fields with l = −12.0° between b = −1.0° and b = 0.0°. The colour scale is the same as Fig. 1. As can be seen, there is a sudden increase in the extinction at (J − KS,mK) ~ (2,14) in the plane that is not visible at higher |b|. Also, the second maxima of the RCGs is visible in the bottom plot, roughly at (J − KS,KS) = (2,15).
Current usage metrics show cumulative count of Article Views (full-text article views including HTML views, PDF and ePub downloads, according to the available data) and Abstracts Views on Vision4Press platform.
Data correspond to usage on the plateform after 2015. The current usage metrics is available 48-96 hours after online publication and is updated daily on week days.
Initial download of the metrics may take a while.