Fig. 9
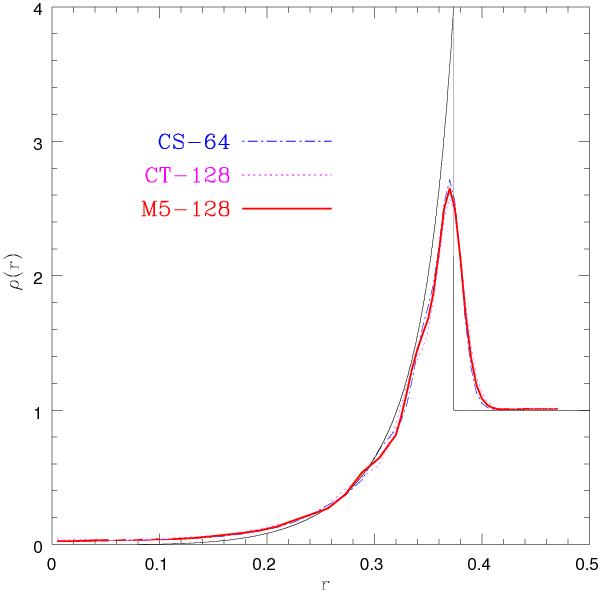
Radial density profiles of the 3D Sedov blast wave test at t = 0.06. The solid black line indicates the analytic solution, while the simulation profiles are obtained by averaging for each radial bin SPH densities calculated from the particle distributions over a set of grid points located at the surface of a spherical shell and uniformly spaced in angular coordinates. All of the runs were performed using N = 524 288 particles.
Current usage metrics show cumulative count of Article Views (full-text article views including HTML views, PDF and ePub downloads, according to the available data) and Abstracts Views on Vision4Press platform.
Data correspond to usage on the plateform after 2015. The current usage metrics is available 48-96 hours after online publication and is updated daily on week days.
Initial download of the metrics may take a while.