Fig. 8
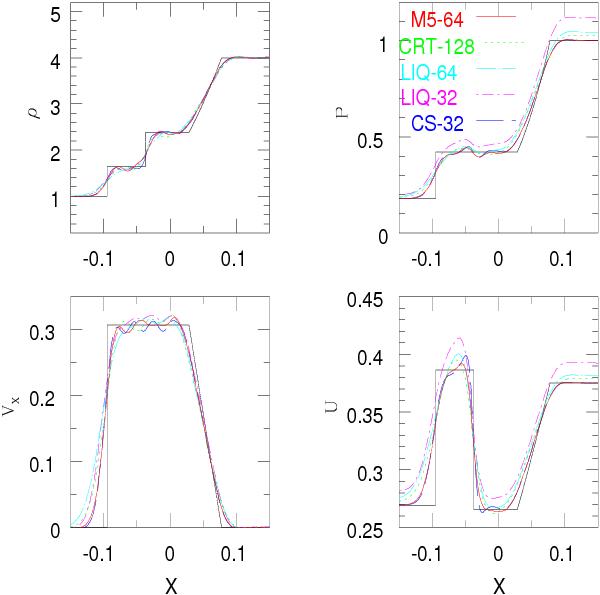
Results at t = 0.12 of the 3D shock tube test. The profiles of density, pressure, thermal energy, and velocity are plotted clockwise from top left. The solid black line represents the analytical solution, while lines with different styles and colors are the profiles of the AC-SPH runs with different kernels and neighbor numbers, as illustrated in the pressure panel.
Current usage metrics show cumulative count of Article Views (full-text article views including HTML views, PDF and ePub downloads, according to the available data) and Abstracts Views on Vision4Press platform.
Data correspond to usage on the plateform after 2015. The current usage metrics is available 48-96 hours after online publication and is updated daily on week days.
Initial download of the metrics may take a while.