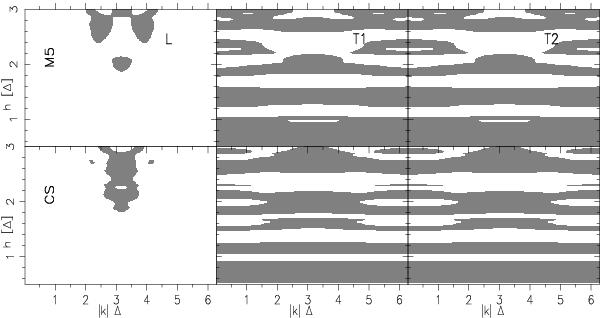
Fig. 7

Contour plots of the dispersion relation given in Eq. (40) are shown as a function of wavenumber k and smoothing length h for a regular lattice of particles with spacing Δ, where we consider a wavevector with orientation k = k(1,0,0). Gray areas indicate the instability regions for which ω2 < 0. From the left to right, the top panels show in the case of the M5 kernel the instability regions of the longitudinal and the two transverse waves. The bottom panels refer to the CS (M4) kernel.
Current usage metrics show cumulative count of Article Views (full-text article views including HTML views, PDF and ePub downloads, according to the available data) and Abstracts Views on Vision4Press platform.
Data correspond to usage on the plateform after 2015. The current usage metrics is available 48-96 hours after online publication and is updated daily on week days.
Initial download of the metrics may take a while.


