Fig. 15
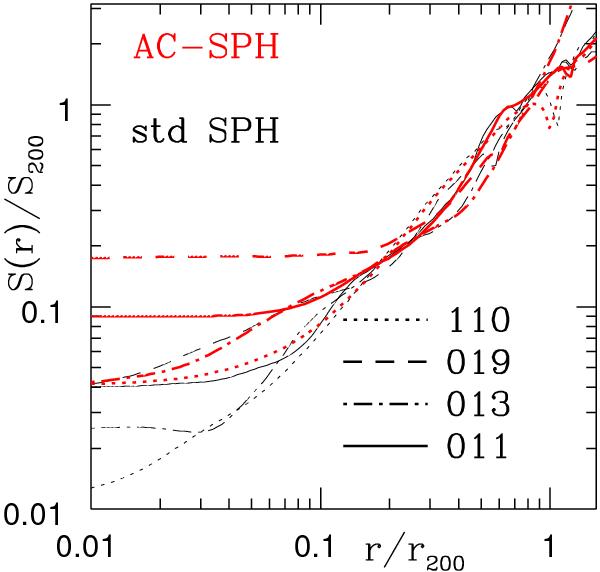
Final radial entropy profiles as a function of r/r200 for the four relaxed test clusters. The gas entropy  is plotted in units of S200 Different line styles refer to different clusters, the numbers indicating the cluster membership in the cosmological ensemble from which they have been extracted. Thin (black) lines are for the profiles of runs performed using the standard SPH formulation, while thick (red) lines refer to the AC-SPH runs incorporating the AC term.
Current usage metrics show cumulative count of Article Views (full-text article views including HTML views, PDF and ePub downloads, according to the available data) and Abstracts Views on Vision4Press platform.
Data correspond to usage on the plateform after 2015. The current usage metrics is available 48-96 hours after online publication and is updated daily on week days.
Initial download of the metrics may take a while.