Fig. 14
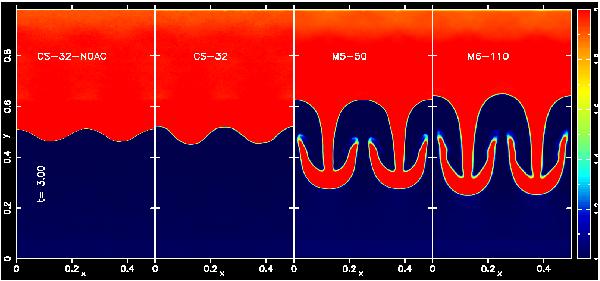
Density maps of the 2D Rayleigh-Taylor tests are shown at time t = 3 for standard SPH (NOAC) and AC-SPH simulations performed using N = 6202 particles with different kernels and neighbor numbers. The density distributions can be compared directly with the map shown in Fig. 4 of (Abell 2011,top right panel), as the adopted initial conditions for the tests are the same.
Current usage metrics show cumulative count of Article Views (full-text article views including HTML views, PDF and ePub downloads, according to the available data) and Abstracts Views on Vision4Press platform.
Data correspond to usage on the plateform after 2015. The current usage metrics is available 48-96 hours after online publication and is updated daily on week days.
Initial download of the metrics may take a while.