Fig. 12
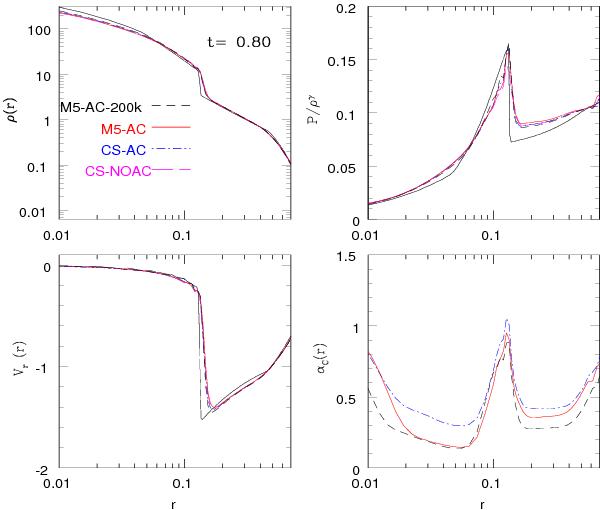
Radially averaged profiles at t = 0.8 of the Evrard collapse test. Clockwise from the top left panel: profiles of density, entropy, artificial conductivity parameter αC, and radial velocity. Curves with different line styles and colors refer to SPH runs performed using different kernels and with (AC) or without (NOAC) the AC term in the SPH energy equation. The black solid lines indicate the 1D PPM reference solution of Steinmetz & Mueller (1993).
Current usage metrics show cumulative count of Article Views (full-text article views including HTML views, PDF and ePub downloads, according to the available data) and Abstracts Views on Vision4Press platform.
Data correspond to usage on the plateform after 2015. The current usage metrics is available 48-96 hours after online publication and is updated daily on week days.
Initial download of the metrics may take a while.