Free Access
Fig. 9
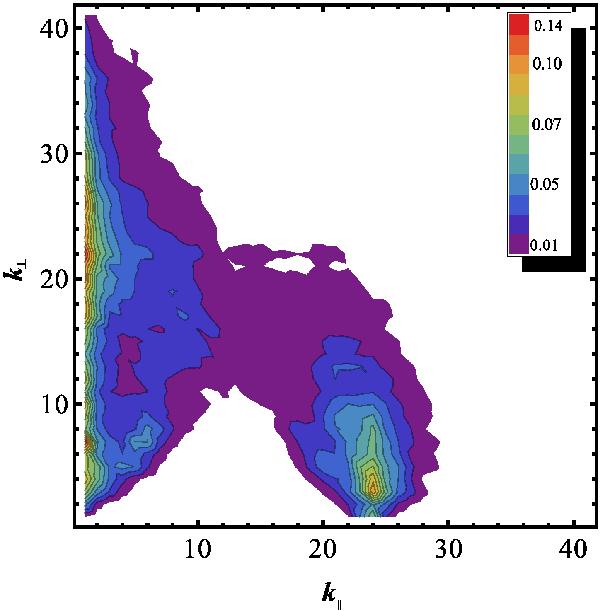
Map of the critical balance parameter ζ for the right-hand plot in Fig. 8. The contours linearly represent values between 0.01 and 0.14 of the integral values of ζ(k∥,k⊥). The peak structure and values near the k⊥-axis are clearly visible.
Current usage metrics show cumulative count of Article Views (full-text article views including HTML views, PDF and ePub downloads, according to the available data) and Abstracts Views on Vision4Press platform.
Data correspond to usage on the plateform after 2015. The current usage metrics is available 48-96 hours after online publication and is updated daily on week days.
Initial download of the metrics may take a while.