Fig. 6
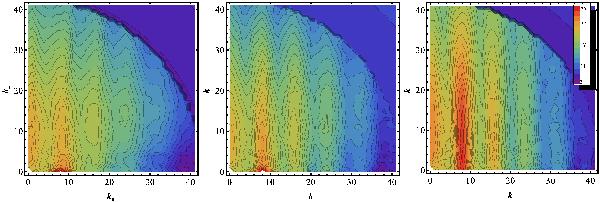
Two-dimensional magnetic energy spectra of a peak at normalised wavenumber 8. Red regions are at higher energies compared to the blue ones. The parallel and perpendicular wavenumbers are given as absolute values. The time development is shown for mid-drive (Δt ≈ 0.85s), max-peak (Δt ≈ 1.7s) and the decay 17 s after the driving. The colours of the contours were normalised for comparison between the three plots. The colours indicate the logarithm of the total spectral energy. The simulation setup SI was used.
Current usage metrics show cumulative count of Article Views (full-text article views including HTML views, PDF and ePub downloads, according to the available data) and Abstracts Views on Vision4Press platform.
Data correspond to usage on the plateform after 2015. The current usage metrics is available 48-96 hours after online publication and is updated daily on week days.
Initial download of the metrics may take a while.