Free Access
Fig. 4
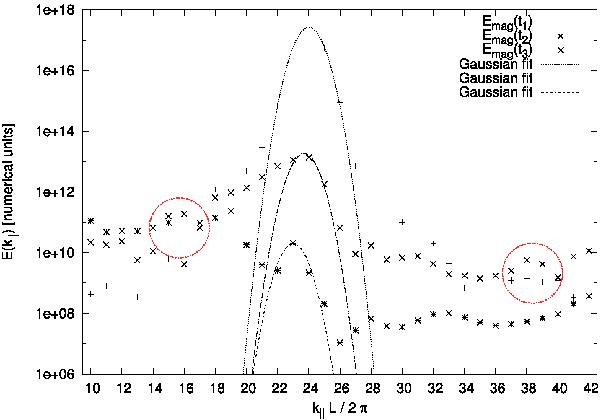
Simulation setup SI: one-dimensional energy spectrum E(k∥) of the peak at numerical wavenumber 24 ( ) with higher growth rate Γ2. The influence of the diffusion process is significant because the peak is broadening during time evolution. Adjoining maxima develop, e.g. at
  and 38, highlighted by red circles.
Current usage metrics show cumulative count of Article Views (full-text article views including HTML views, PDF and ePub downloads, according to the available data) and Abstracts Views on Vision4Press platform.
Data correspond to usage on the plateform after 2015. The current usage metrics is available 48-96 hours after online publication and is updated daily on week days.
Initial download of the metrics may take a while.