Free Access
Fig. 3
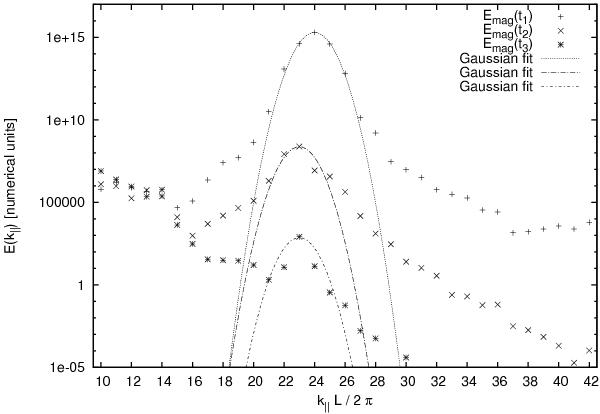
Simulation setup SI: time evolution of a Gaussian-distributed amplification at numerical wavenumber 24 ( ) at the lower growth rate Γ1. The spectrum is a one-dimensional cut along the parallel wavenumber axis where the peak is located. The peak is clearly shifted towards smaller k∥.
Current usage metrics show cumulative count of Article Views (full-text article views including HTML views, PDF and ePub downloads, according to the available data) and Abstracts Views on Vision4Press platform.
Data correspond to usage on the plateform after 2015. The current usage metrics is available 48-96 hours after online publication and is updated daily on week days.
Initial download of the metrics may take a while.