Free Access
Fig. 12
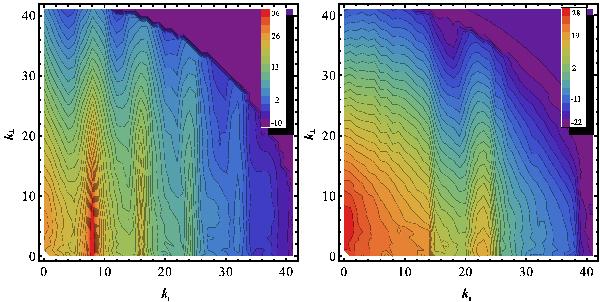
Evolution of the two peak positions at tmid in setup SIII. Very strong perpendicular development in all SIII simulations is observed. The edge of the parallel driving range at  is clearly visible in the right-hand panel.
Current usage metrics show cumulative count of Article Views (full-text article views including HTML views, PDF and ePub downloads, according to the available data) and Abstracts Views on Vision4Press platform.
Data correspond to usage on the plateform after 2015. The current usage metrics is available 48-96 hours after online publication and is updated daily on week days.
Initial download of the metrics may take a while.