Fig. 54
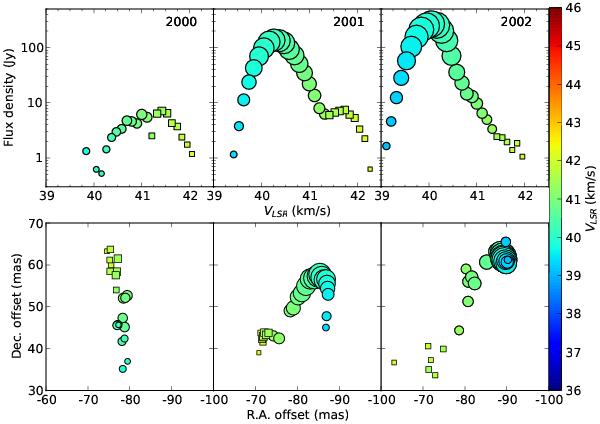
MERLIN observations of the maser feature at the velocity of the flare from W Hya seen in Pushchino data at 20011023 (Fig. 43). The upper three plots show the velocity profiles at the epochs bracketing the flare. The brighter, more blue-shifted feature is shown by circles, and an adjacent feature by squares. Symbol size is proportional to the square root of flux density. The lower three plots show the corresponding maser positions, showing that the weaker feature has moved from N to S and brighter feature has moved across it in the opposite direction from S to NW.
Current usage metrics show cumulative count of Article Views (full-text article views including HTML views, PDF and ePub downloads, according to the available data) and Abstracts Views on Vision4Press platform.
Data correspond to usage on the plateform after 2015. The current usage metrics is available 48-96 hours after online publication and is updated daily on week days.
Initial download of the metrics may take a while.