Fig. 46
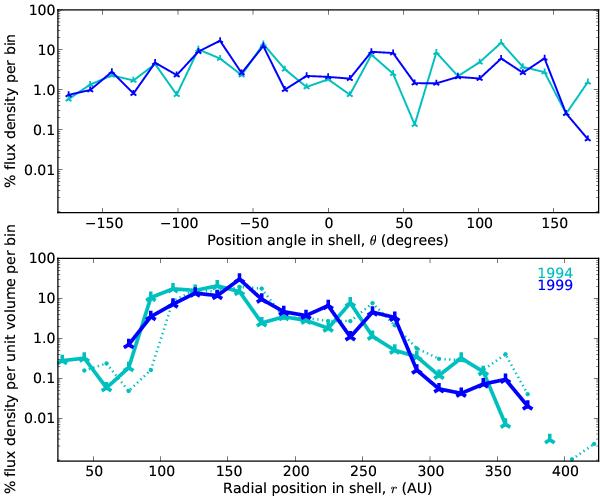
VX Sgr. The lower plot shows the percentage flux density per unit volume in concentric spherical shells (heavy lines, colour coded by epoch). The fainter dotted lines show how the earlier masers would appear if they had flowed out unchanged to the time of the latest epoch. The upper plot shows percentage flux density per segment of angle in the plane of the sky (colour coded by epoch). An isolated marker is shown if the bins on either side are empty.
Current usage metrics show cumulative count of Article Views (full-text article views including HTML views, PDF and ePub downloads, according to the available data) and Abstracts Views on Vision4Press platform.
Data correspond to usage on the plateform after 2015. The current usage metrics is available 48-96 hours after online publication and is updated daily on week days.
Initial download of the metrics may take a while.