Fig. 32
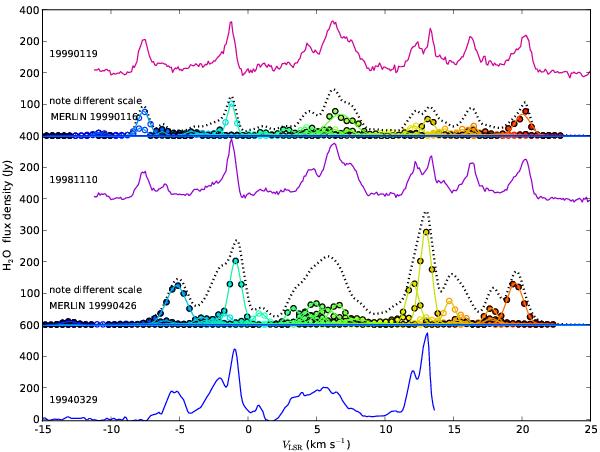
22-GHz H2O maser spectra towards VX Sgr at the epochs as labelled. Data are from the Pushchino radio telescope except where labelled MERLIN. The coloured MERLIN spectra show individual features, the components with black outlines were matched at successive epochs. The dotted black lines show the total emission detected per epoch by MERLIN. The label of the origin (0) for the vertical scale of each spectrum is only shown for the first (lowest) in the series.
Current usage metrics show cumulative count of Article Views (full-text article views including HTML views, PDF and ePub downloads, according to the available data) and Abstracts Views on Vision4Press platform.
Data correspond to usage on the plateform after 2015. The current usage metrics is available 48-96 hours after online publication and is updated daily on week days.
Initial download of the metrics may take a while.