Fig. 31
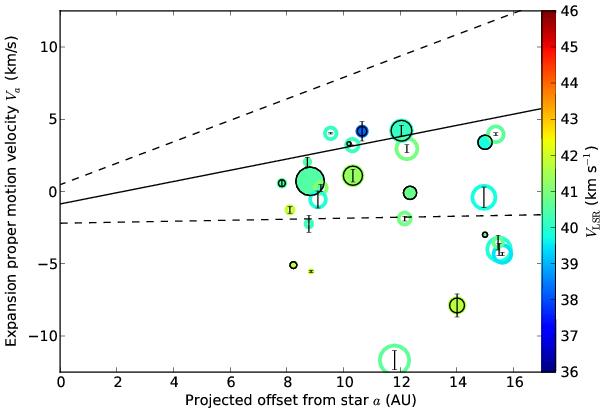
Relationship between dVa and  for W Hya. Symbol size is proportional to feature size. Proper motions derived from features matched in 2001–2002 or at 3 epochs are shown by solid symbols. The other two-epoch proper motions, with high uncertainties as discussed in the text, are shown by hollow symbols. The linear error-weighted least-squares fit and dispersion for the 3-epoch and 2001–2002 data are plotted by the solid and dashed lines.
Current usage metrics show cumulative count of Article Views (full-text article views including HTML views, PDF and ePub downloads, according to the available data) and Abstracts Views on Vision4Press platform.
Data correspond to usage on the plateform after 2015. The current usage metrics is available 48-96 hours after online publication and is updated daily on week days.
Initial download of the metrics may take a while.