Fig. 22
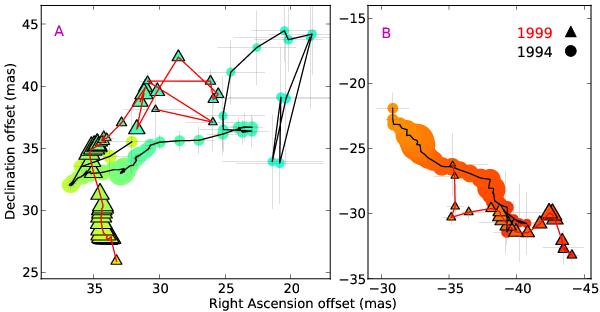
Two of the S Per features matched in 1994 (circles) and 1999 (triangles), marked on Fig. 5. The velocity ranges are − 45.7 to − 35.9 km s-1 and − 32.8 to − 28.5 km s-1 respectively, see Fig. 5 for colour scale. The left-hand feature has rotated counterclockwise, in bulk, and moved slightly S between 1994 and 1999. The right-hand feature has moved to the SW whilst retaining the elongated distribution of the components.
Current usage metrics show cumulative count of Article Views (full-text article views including HTML views, PDF and ePub downloads, according to the available data) and Abstracts Views on Vision4Press platform.
Data correspond to usage on the plateform after 2015. The current usage metrics is available 48-96 hours after online publication and is updated daily on week days.
Initial download of the metrics may take a while.