Free Access
Fig. 14
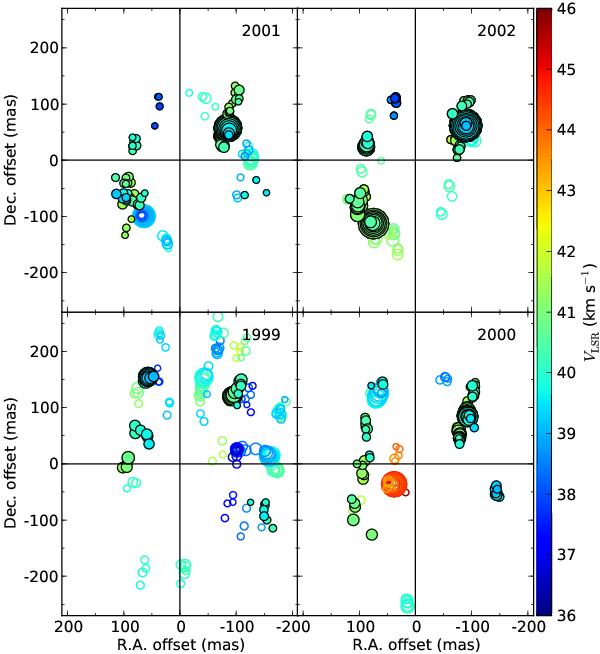
22-GHz H2O maser components around W Hya imaged in 1999–2002. Symbol area is proportional to flux density. The components with black outlines belong to features matched at two or more epochs.
Current usage metrics show cumulative count of Article Views (full-text article views including HTML views, PDF and ePub downloads, according to the available data) and Abstracts Views on Vision4Press platform.
Data correspond to usage on the plateform after 2015. The current usage metrics is available 48-96 hours after online publication and is updated daily on week days.
Initial download of the metrics may take a while.