Free Access
Fig. 6
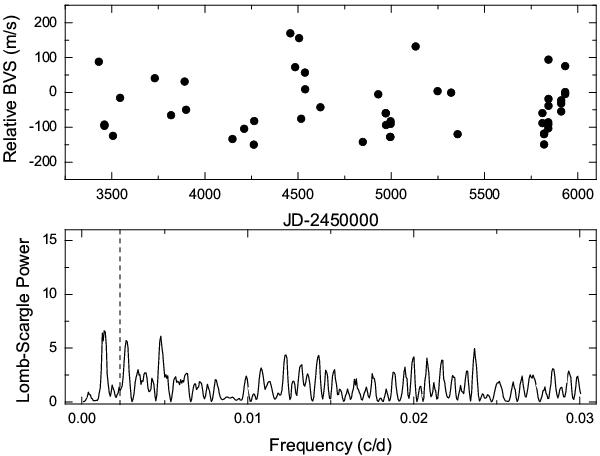
The examinations of the origin of the BVS variations for ϵ CrB. It shows JD vs. BVS variations (top panel) from February 2005 to January 2012 and the Lomb-Scargle periodogram of the BVS variations (bottom panel). The vertical dashed line marks the location of the periods of 418 days.
Current usage metrics show cumulative count of Article Views (full-text article views including HTML views, PDF and ePub downloads, according to the available data) and Abstracts Views on Vision4Press platform.
Data correspond to usage on the plateform after 2015. The current usage metrics is available 48-96 hours after online publication and is updated daily on week days.
Initial download of the metrics may take a while.