Fig. 7
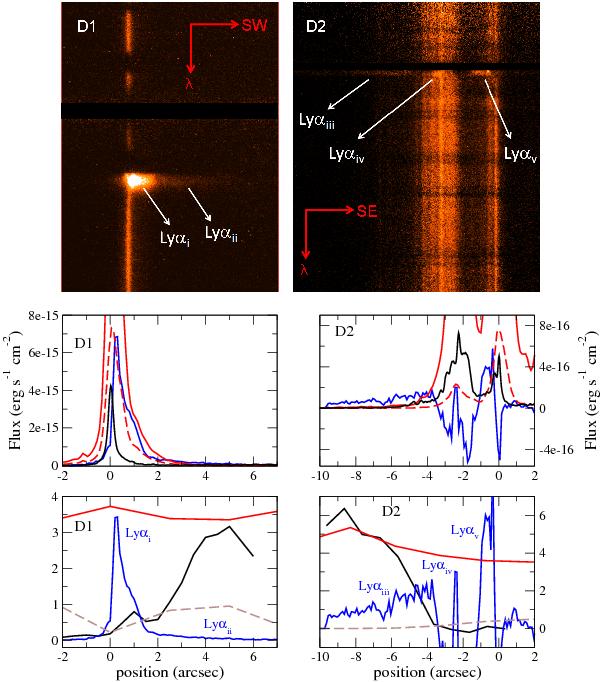
Left: slit along direction D1. Top-left: HST/STIS G140M spectral image of Haro 2. Middle-left: emission profiles of Lyα (blue) and UV continuum (1175 Å rest frame, black) from STIS data, and Hα (red) from WFPC2 data. Bottom-left: spatial profiles of Lyα (blue) and observed Lyα/Hα (black) and Hα/Hβ (from WHT/ISIS data, in red). Right: slit along direction D2. Top-right: HST/STIS G140L spectral image. Middle-right: emission profiles of Lyα (blue) and UV continuum (1227 Å, black) from STIS data, and Hα (red) from WFPC2 data. Bottom-right: spatial profiles of Lyα (blue) and observed Lyα/Hα (black) and Hα/Hβ (from WHT/ISIS data, in red). The geocoronal Lyα line has been blackened in both spectral images at the top. In the middle and bottom panels positive x-axis corresponds to southwest (left) and southeast (right). Vertical scale in the middle panels corresponds to the Lyα and Hα fluxes. To ease the comparison, the dashed line shows the Hα profile scaled by a factor 0.4 (left) and 0.085 (right). The vertical scale in the bottom panels corresponds to the Lyα/Hα and Hα/Hβ ratios. The brown dashed lines represent the expected Lyα/Hα ratio, assuming case B recombination and applying the internal reddening derived from the observed Hα/Hβ ratio (Balmer decrement), as well as the Galactic extinction.
Current usage metrics show cumulative count of Article Views (full-text article views including HTML views, PDF and ePub downloads, according to the available data) and Abstracts Views on Vision4Press platform.
Data correspond to usage on the plateform after 2015. The current usage metrics is available 48-96 hours after online publication and is updated daily on week days.
Initial download of the metrics may take a while.