Fig. 4
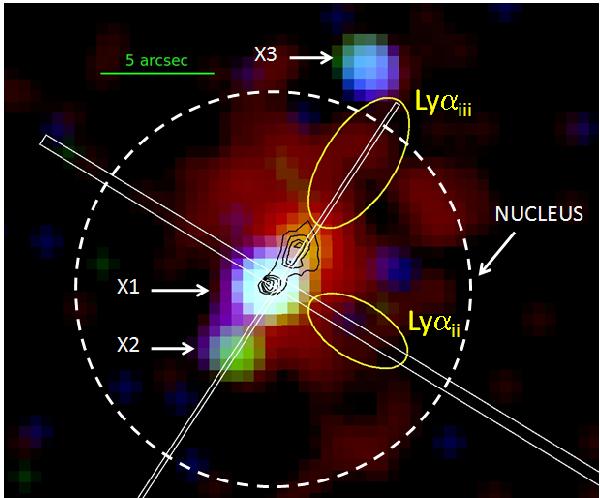
Color-coded Chandra X-ray image of Haro 2: soft (0.2–1.5 keV, red), medium (1.5–2.5 keV, green) and hard X-rays (2.5–8.0 keV, blue). The contours of the NICMOS near-infrared continuum and the position of the STIS slits have been superimposed. Main X-ray components are labeled. Source region from which X-ray spectrum was extracted is confined within the dashed circle. Regions within the yellow ellipses show diffuse Lyα emission.
Current usage metrics show cumulative count of Article Views (full-text article views including HTML views, PDF and ePub downloads, according to the available data) and Abstracts Views on Vision4Press platform.
Data correspond to usage on the plateform after 2015. The current usage metrics is available 48-96 hours after online publication and is updated daily on week days.
Initial download of the metrics may take a while.