Fig. 2
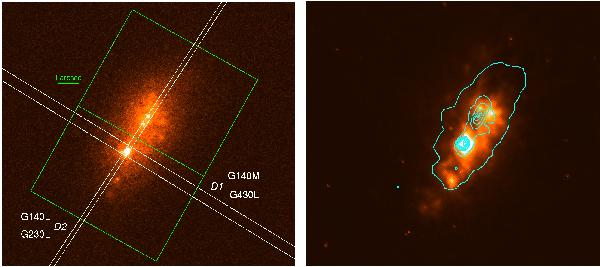
Left: ultraviolet HST/FOC image of Haro 2, together with the locations of the HST/STIS slits D1 (gratings G140M and G430L) (Mas-Hesse et al. 2003), and D2 (G140L and G230L) (Chandar et al. 2004), and the boxes used to extract the UV flux from each knot. The width of the slits is represented at real scale. North is up and east is left. Right: Hα image obtained with HST/WFPC2, with the UV continuum contours superimposed.


Current usage metrics show cumulative count of Article Views (full-text article views including HTML views, PDF and ePub downloads, according to the available data) and Abstracts Views on Vision4Press platform.
Data correspond to usage on the plateform after 2015. The current usage metrics is available 48-96 hours after online publication and is updated daily on week days.
Initial download of the metrics may take a while.