Fig. 8
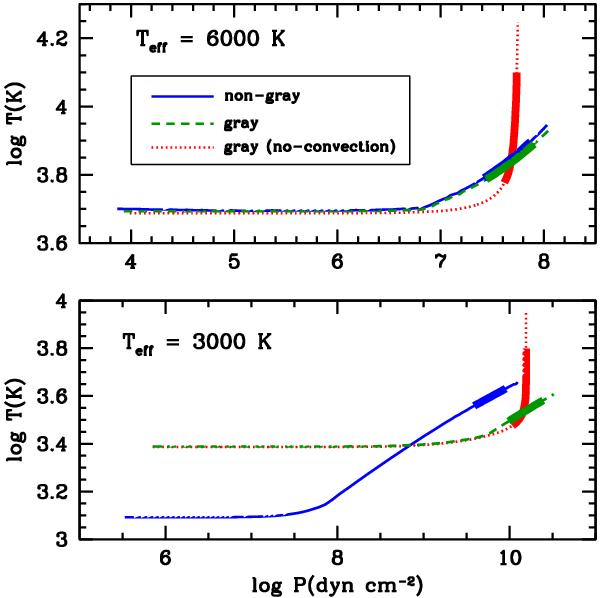
Temperature-pressure stratifications of pure hydrogen atmospheres with Teff = 3000 K and 6000 K (log g = 8), for different assumptions as indicated in the plot. The top and bottom layers of each model are located at τRoss = 10-6 and τRoss = 100, respectively. The thick lines show the layers located between τRoss ≈ 2/3 and τRoss ≈ 25.
Current usage metrics show cumulative count of Article Views (full-text article views including HTML views, PDF and ePub downloads, according to the available data) and Abstracts Views on Vision4Press platform.
Data correspond to usage on the plateform after 2015. The current usage metrics is available 48-96 hours after online publication and is updated daily on week days.
Initial download of the metrics may take a while.