Free Access
Fig. 9
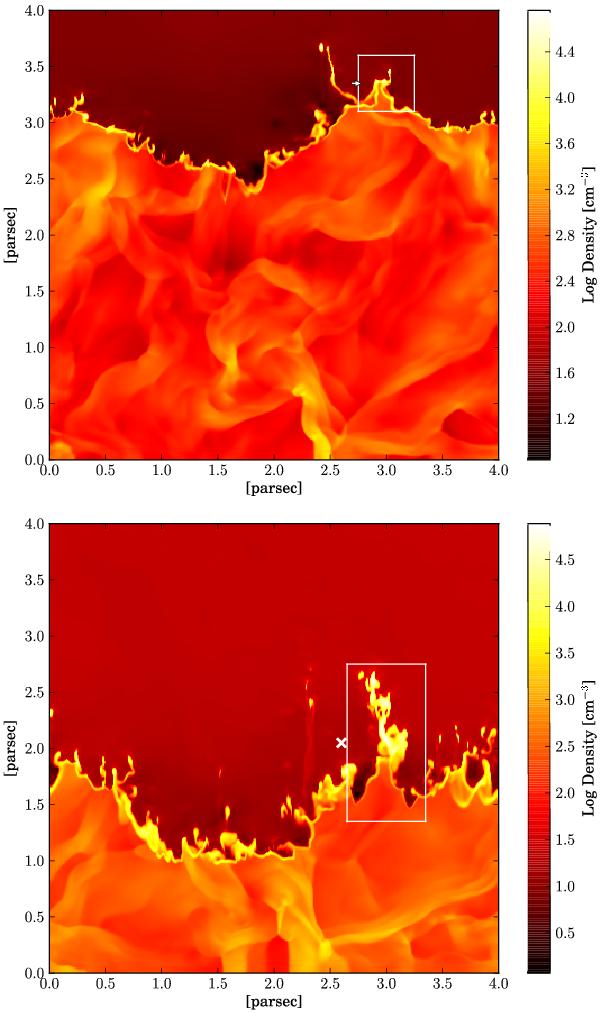
Density cut at t ≈ 240 ky and t ≈ 710 ky after ionization is turned on. The white box indicates the areas of the column density and line-of-sight velocity spectra made in Figs. 11 and 12. The arrow indicates the direction of the line of sight; for the cross, the line of sight is perpendicular to the density cut plane.
This figure is made of several images, please see below:
Current usage metrics show cumulative count of Article Views (full-text article views including HTML views, PDF and ePub downloads, according to the available data) and Abstracts Views on Vision4Press platform.
Data correspond to usage on the plateform after 2015. The current usage metrics is available 48-96 hours after online publication and is updated daily on week days.
Initial download of the metrics may take a while.