Fig. 5
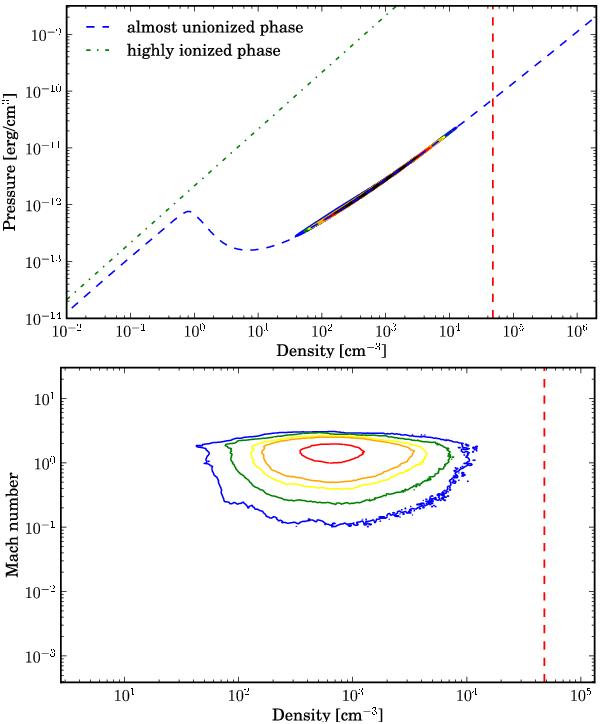
Two-dimensional plot of the mass fraction at given density and pressure (top) and at given density and Mach number (bottom), before ionization is turned on in the simulation with a mean Mach number of one. Blue to black contours are increasing mass-fraction contours (blue 1E-6, green 1E-5, yellow 5E-5, orange 1E-4, red 5E-4, black 2E-3). The dashed-red line at 4.8 × 104 cm-3 is the maximum density achieved in a plane-parallel 1D simulation for a homogeneous density of 500 cm-3.
Current usage metrics show cumulative count of Article Views (full-text article views including HTML views, PDF and ePub downloads, according to the available data) and Abstracts Views on Vision4Press platform.
Data correspond to usage on the plateform after 2015. The current usage metrics is available 48-96 hours after online publication and is updated daily on week days.
Initial download of the metrics may take a while.