Fig. 11
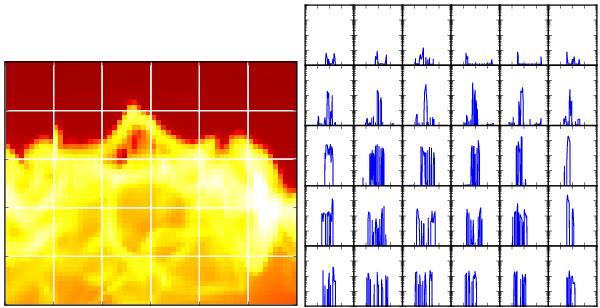
Left: column density in a 0.6 × 0.5 × 0.5 pc3 box around the area in which the pillar will form at t ≈ 240 ky. Right: mass-weighted histogram of the line-of-sight velocity in the same box (similar to optically thin observational line spectra). Each spectrum is made on a square of 0.1 × 0.1 pc2 drawn on the column density map. The spectra are drawn between − 4 and 4 km s-1 in 80 bins (horizontal axis) and for mass between 104 and 1 solar masses (vertical axis in log scale). The lateral shocks can be identified in the wide spectra leading to a very broad line width.
Current usage metrics show cumulative count of Article Views (full-text article views including HTML views, PDF and ePub downloads, according to the available data) and Abstracts Views on Vision4Press platform.
Data correspond to usage on the plateform after 2015. The current usage metrics is available 48-96 hours after online publication and is updated daily on week days.
Initial download of the metrics may take a while.