Fig. 3
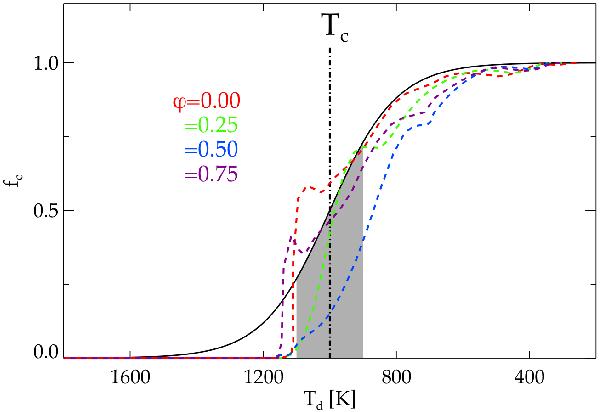
Degree of condensation as a function of grain temperature, using the parameterized dust description outlined in Sect. 3.2 (solid black line), and for a model with a detailed description of Mg2SiO4 grains (Höfner 2008, model A; dashed lines). The different dashed curves represent a selection of pulsation phases ϕ from the detailed model, where the degree of condensation has been normalized to vary between 0 and 1 to facilitate comparing the shape of the curves. The grey zone indicates how the parameter ΔT sets the width of the dust formation zone.
Current usage metrics show cumulative count of Article Views (full-text article views including HTML views, PDF and ePub downloads, according to the available data) and Abstracts Views on Vision4Press platform.
Data correspond to usage on the plateform after 2015. The current usage metrics is available 48-96 hours after online publication and is updated daily on week days.
Initial download of the metrics may take a while.