Fig. 2
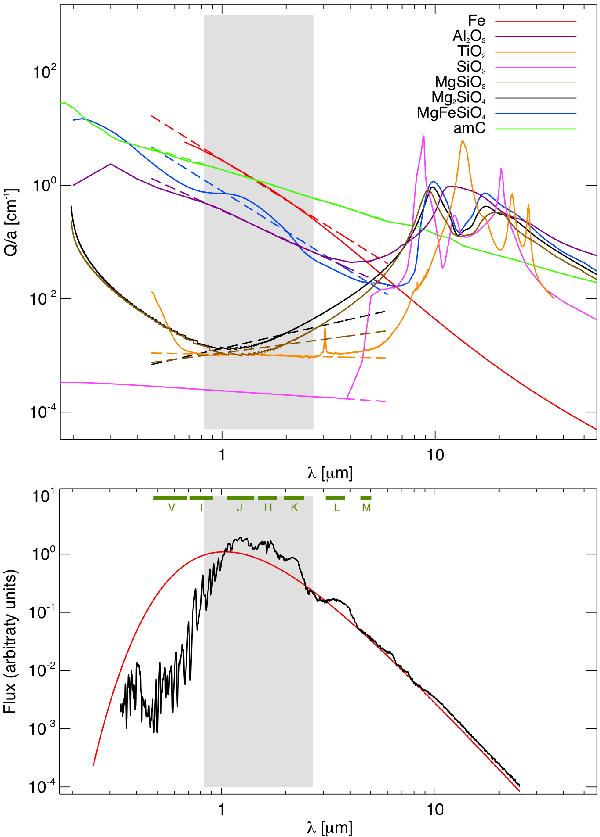
Top panel: efficiency per grain radius Qacc/agr, in the small particle limit, as a function of wavelength for a selection of dust species. The dashed lines show the power law fit according to Eq. (20) and the shaded area indicates the wavelength region for which the optical data is fitted. Lower panel: normalized flux of the hydrostatic initial model (black) and the Planck function for Teff = 2800 K (red). Due to absorption by TiO molecules in the visual the flux of the initial model is very non-Planckian in this wavelength region.
Current usage metrics show cumulative count of Article Views (full-text article views including HTML views, PDF and ePub downloads, according to the available data) and Abstracts Views on Vision4Press platform.
Data correspond to usage on the plateform after 2015. The current usage metrics is available 48-96 hours after online publication and is updated daily on week days.
Initial download of the metrics may take a while.