Fig. 8
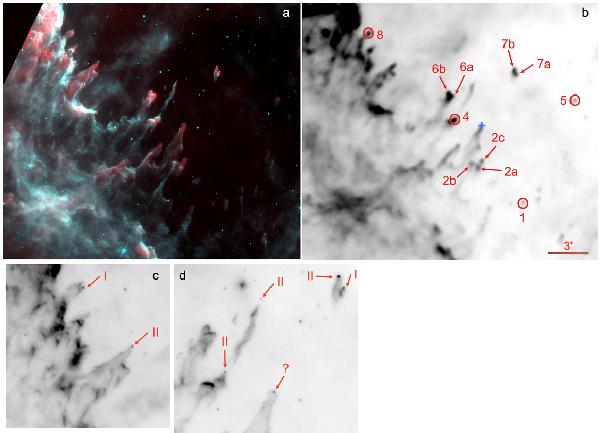
The IR emission from the “pillars” located south-east of W5-E. a) Colour composite image showing in red the 250 μm cold dust emission and in turquoise the 8.0 μm PAH emission. b) Identification of a few pillars on the grey-scale Herschel 250 μm image. c), d) Details of the pillars: the grey-scale underlying Spitzer 24 μm image shows Class I/II sources lying at the tip of the pillars (from KOE08). North is up and east is left.
Current usage metrics show cumulative count of Article Views (full-text article views including HTML views, PDF and ePub downloads, according to the available data) and Abstracts Views on Vision4Press platform.
Data correspond to usage on the plateform after 2015. The current usage metrics is available 48-96 hours after online publication and is updated daily on week days.
Initial download of the metrics may take a while.