Fig. 7
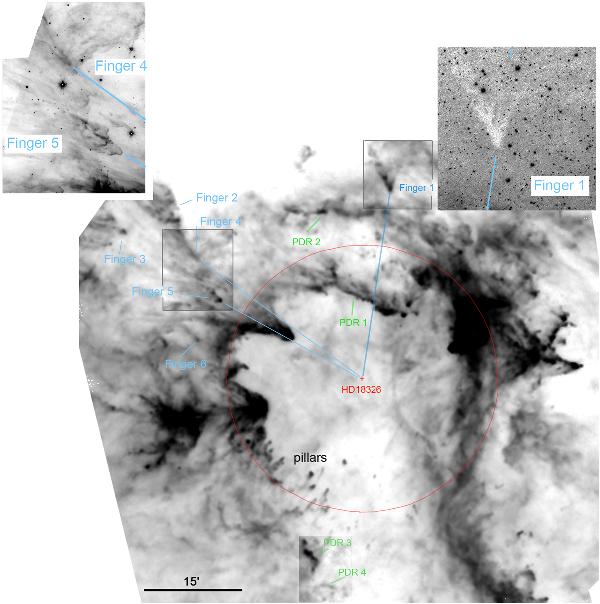
Morphology of W5-E. Peculiar structures discussed in the text (PDRs, fingers, pillars) are identified on the 350 μm image (logarithmic scale). The red circle shows the approximate extent of the optical H ii region (radius 12 pc). The right insert shows finger #1 in absorption, on a DSS-red image. The left insert shows fingers #4 and #5 pointing towards the exciting star, as they appear on the Spitzer 8.0 μm image (fingers #2 and #3 lie outside the Spitzer field). North is up and east is left.
Current usage metrics show cumulative count of Article Views (full-text article views including HTML views, PDF and ePub downloads, according to the available data) and Abstracts Views on Vision4Press platform.
Data correspond to usage on the plateform after 2015. The current usage metrics is available 48-96 hours after online publication and is updated daily on week days.
Initial download of the metrics may take a while.